
Mastering machine learning model monitoring for reliable AI performance
- shalicearns80
- Jan 13
- 16 min read
Here's a hard truth most businesses ignore: your machine learning models are degrading as you read this. Even the sharpest, most accurate models begin to fail silently the moment they hit the real world. This leads to garbage predictions, poor business outcomes, and some serious compliance headaches. The only way to catch this decay before it does real damage is with proper machine learning model monitoring.
Why Your AI Models Are Silently Failing in Production
Getting a machine learning model into production often feels like crossing the finish line, but it's really just the starting gun for a much longer race. Without a solid monitoring system, that star-performing model starts a slow, invisible slide into irrelevance the second it meets live data.
Think of an unmonitored model like a self-driving car with no dashboard. Everything seems fine—until it suddenly veers off the road and causes a major pile-up.
This silent failure happens because the world doesn't stand still. Customer behavior shifts, market trends evolve, and the data sources you rely on are constantly being updated. These changes—what we call data drift and concept drift—create a growing gap between the data your model trained on and the data it sees today. The result? A steady drop in accuracy that can go unnoticed for months, quietly eating away at your ROI.

Pioneering Proactive AI Since 2013
This is a problem Freeform has been tackling for over a decade. As a pioneering force in marketing AI established in 2013, we solidified our position as an industry leader by figuring out early on that building the model is only half the job. The real trick—the thing that separates a successful AI initiative from an expensive science project—is maintaining its performance and ensuring it stays reliable for the long haul.
Too many traditional marketing agencies treat AI deployment as a one-and-done deal, completely ignoring the critical life of the model after it goes live. This reactive approach leaves you wide open to the silent decay of your models. At Freeform, our entire methodology is built around proactive, continuous oversight.
Machine learning model monitoring isn't just a tech chore; it's a core business strategy. It’s how you safeguard your investment, ensure compliance, and keep your competitive edge. It turns your AI from a depreciating asset into one that consistently delivers value.
This proactive stance gives our clients a massive leg up. By catching and correcting model decay before it hits the bottom line, we deliver distinct advantages over traditional marketing agencies:
Enhanced Speed: We spot and fix issues fast, avoiding the long stretches of poor performance that plague unmonitored systems.
Superior Cost-Effectiveness: Proactive care prevents the costly emergency fixes, lost revenue, and brand damage that come with sudden model failure.
Better Results: Our models consistently deliver on their promise because they are always kept in sync with the real world, providing superior outcomes.
Ultimately, ignoring model monitoring is a huge gamble for any organization. It exposes you to significant business and compliance risks that just aren't worth taking. A comprehensive monitoring strategy is non-negotiable for anyone serious about building AI they can trust. To get started on the right foot, you can learn about the foundational principles of effective data governance in our detailed overview. This guide will give you the practical steps needed to build a monitoring framework that protects your models and drives lasting value.
Understanding the Fundamentals of Model Degradation
Here’s a hard truth: a machine learning model starts to lose its edge the moment it goes live. To build a solid machine learning model monitoring strategy, you first have to understand why this happens. Model degradation isn’t a sign that you built a bad model; it’s just a natural side effect of a world that won’t stop changing.
Think of your model as a snapshot of reality. It was trained on historical data, capturing the patterns and relationships of a specific moment in time. But the real world is anything but static. When the live data flowing into your model no longer looks like the data it trained on, its predictions start to go sideways. This growing gap between the training sandbox and the production battlefield is the root of almost every model failure.
The Core Causes of Model Decay
Three main culprits are behind this decay: data drift, concept drift, and training-serving skew. Getting your head around these ideas is the first real step toward building a monitoring plan that actually protects your AI’s performance and its value to the business.
Data Drift: When the Ingredients Change
Imagine a weather forecasting model trained on decades of winter data from snowy, mountainous regions. It’s a genius at predicting blizzards. Now, what happens when you ask that same model to predict a summer heatwave in the tropics? The inputs—temperature, humidity, atmospheric pressure—are a world away from what it was taught. That’s data drift in a nutshell.

Data drift happens when the statistical DNA of your input data changes, even if the underlying relationships haven't. Some common causes are:
Shifting Demographics: Your user base suddenly expands to new countries or attracts a different age group.
Upstream Data Changes: A team that owns one of your data sources decides to change a format or collection method without telling you.
New Trends: Customer behavior and market preferences are always evolving.
Drift is often a slow burn, making it a silent killer of model accuracy. Without good monitoring, your model could be making confidently wrong predictions for weeks or even months before anyone notices.
Concept Drift: When the Rules of the Game Change
Now, let's look at a different kind of problem. Concept drift is deeper—it’s when the very relationship between your model's inputs and its outputs changes.
Take a fraud detection model trained before "buy now, pay later" services became popular. Back then, a sudden, large purchase from a brand-new device might have been a huge red flag for fraud. Today, that exact pattern is perfectly normal, legitimate behavior. The very definition of what constitutes fraud has changed.
Concept drift means the ground truth has shifted. What was once a reliable pattern is no longer true, forcing the model to operate on outdated assumptions. This often requires not just retraining, but a complete rethinking of the model's features and logic.
Big, sudden events are classic triggers for concept drift. Think of a global pandemic, a supply chain crisis, or a major economic downturn. These shocks can instantly invalidate the patterns your model learned, causing a catastrophic drop in performance.
Training-Serving Skew: The Hidden Discrepancy
Finally, we have training-serving skew. This one is a sneaky technical issue that pops up when there’s a mismatch between how data is handled during training versus in the live production environment.
Maybe a feature is calculated slightly differently, or missing values are imputed in a way that doesn't match the training pipeline. It’s a subtle but damaging error where the model gets data in a format it simply wasn't built to handle, leading to completely unpredictable outputs. This is usually the result of bugs or quiet inconsistencies in the data pipeline.
All these factors show why monitoring is a business necessity, not just a technical chore. In fact, organizations that adopt continuous MLOps practices see a 40-50% reduction in model retraining cycles and up to a 35% improvement in prediction reliability. As the global ML market grows to $113.10 billion this year, keeping your models healthy is non-negotiable for ROI. Unmonitored models can see 20-30% spikes in inference latency, creating serious bottlenecks in critical applications. You can explore the full details of these machine learning trends and their impacts to see just how high the stakes are.
The Essential Metrics Your Monitoring System Must Track
So you've decided to monitor your machine learning model. Great. But what exactly should you be looking at? Just pulling in a flood of data won't cut it. You need to track the right metrics—the ones that act as your model's vital signs, telling you when it’s healthy and when it’s time to call the doctor.
Think of your model as a high-performance engine. You wouldn't just listen to see if it's running; you’d be watching the oil pressure, temperature, and fuel consumption. The same principle applies here. Nailing down the right metrics gives you the diagnostic power to spot trouble long before it leads to a total breakdown. Let's break down what you absolutely need to watch.
Data Quality and Drift
Your first line of defense is always the data itself. If the data you're feeding the model is garbage, or if it's changed too much from what it learned on, your predictions are going to be garbage, too. It’s that simple.
Data drift is the big one here. It’s a measure of how much the real-world, live data has strayed from the dataset used during training. A little bit of drift is expected—the world changes. But when that shift becomes significant, it's a huge red flag that your model is operating in a world it no longer understands.
Here's a sobering statistic that gets thrown around for a good reason: up to 90% of ML models see their performance tank within the first year in production. The main culprit? Unchecked data drift. We see this all the time. A key metric like the Population Stability Index (PSI) is a perfect example; a PSI over 0.25 is a warning shot, but anything climbing past 0.6 means your data has shifted dramatically and you need to retrain, now. Financial fraud models are notorious for this—as consumer spending habits change, an old model's accuracy can plummet by 30-40% if no one's watching. To get a better handle on this, you can dive deeper into MLOps model monitoring strategies and see how to get ahead of the curve.
Besides drift, you need to keep an eye on the basics of data quality:
Missing Values: Is there a sudden spike in nulls? This usually points to a broken data pipeline upstream.
Data Type Mismatches: If a feature that's supposed to be a number suddenly shows up as text, it can crash your model or produce nonsense.
Range Violations: Are you seeing sensor readings that are physically impossible? That’s a clear sign of corrupted data getting into the system.
Prediction Quality and Model Performance
While data metrics give you an early warning, the real proof is in the pudding: the quality of your model's predictions. This is where the rubber meets the road, connecting your model’s technical behavior directly to business results.
A slow, silent drop in the accuracy of a product recommendation engine, for instance, can quietly kill customer satisfaction and sales over time. Monitoring prediction quality helps you catch that decline before it does real damage.
The specific metrics depend on what your model does:
For Classification Models: Keep a close watch on accuracy, precision, recall, and the F1-score. Don't just look at the overall numbers; check these metrics across different customer segments to spot hidden biases or performance gaps.
For Regression Models: You'll want to monitor things like Mean Absolute Error (MAE) or Root Mean Squared Error (RMSE) to see just how far off your model's predictions are from reality.
The biggest headache here is often getting the "ground truth" labels to compare against, as they can be delayed. When that's the case, you can use the distribution of the model's predictions (output drift) as a proxy. If a fraud model suddenly starts flagging twice as many transactions as it did last week, something is almost certainly wrong.
Operational Health and Resource Usage
Finally, remember that your model doesn't live in a bubble. It's a piece of software running on infrastructure, and its operational health is just as critical as its predictive accuracy. A perfectly accurate model is useless if it's too slow or constantly crashing.
This part of monitoring is all about the technical performance of the system serving the model.
You need to be watching:
Latency: How long does it take to get a prediction back? High latency will kill the user experience in any real-time application.
Throughput: How many predictions can the model churn through per second? This tells you if it can handle the load.
Error Rates: Are you seeing server errors (like 5xx codes) when you call the model's API?
Resource Utilization: Keep tabs on CPU, memory, and disk usage. This helps you prevent system overloads and keep your cloud bills in check.
Let's pull these key metrics together to see the big picture.
Essential Machine Learning Model Monitoring Metrics
The table below outlines the core metrics you should be tracking, what "good" looks like, and what's at stake if you ignore them. This isn't just a technical checklist; it's a direct link between model health and business stability.
Metric Category | Example Metric | Good Threshold | Business Risk if Ignored |
|---|---|---|---|
Data Quality & Drift | Population Stability Index (PSI) | < 0.25 | Model makes decisions on outdated, irrelevant data, leading to poor outcomes. |
Data Quality & Drift | Missing Value Rate | < 1-5% (context-dependent) | Broken data pipelines go unnoticed, predictions become unreliable. |
Prediction Quality | Accuracy / F1-Score | > 90% (context-dependent) | Silent performance degradation erodes trust and business value. |
Prediction Quality | Output Distribution Drift | Low (stable distribution) | Indicates a fundamental change in outcomes that needs investigation. |
Operational Health | Prediction Latency | < 200ms (for real-time) | Poor user experience, abandoned transactions, system bottlenecks. |
Operational Health | Server Error Rate (5xx) | < 0.1% | Unreliable service, system instability, and potential outages. |
Resource Usage | CPU / Memory Utilization | < 80% sustained | Cost overruns, system crashes, and inability to scale on demand. |
Ultimately, a strong monitoring strategy is built on these foundational pillars. By organizing your efforts around Data Quality, Prediction Quality, and Operational Health, you get a complete picture of your model's well-being. This is how you move from constantly fighting fires to proactively keeping your AI systems reliable, effective, and truly valuable to the business.
Building a Practical Model Monitoring Architecture
Knowing the right metrics is one thing, but actually building a system to track them is a completely different ballgame. So, how do you go from theory to a tangible, working machine learning model monitoring architecture?
The good news is you don't have to reinvent the wheel. There’s a practical blueprint most organizations can adapt, whether you're a startup or a massive enterprise. The goal is to create a seamless workflow that captures what your model is doing, analyzes it for signs of trouble, and then serves up those findings in a way that's actually useful. This shifts monitoring from a reactive chore to a proactive strategy that protects your AI investments.
The flowchart below shows this process in action—from data collection all the way to real-time prediction and that all-important retraining loop.
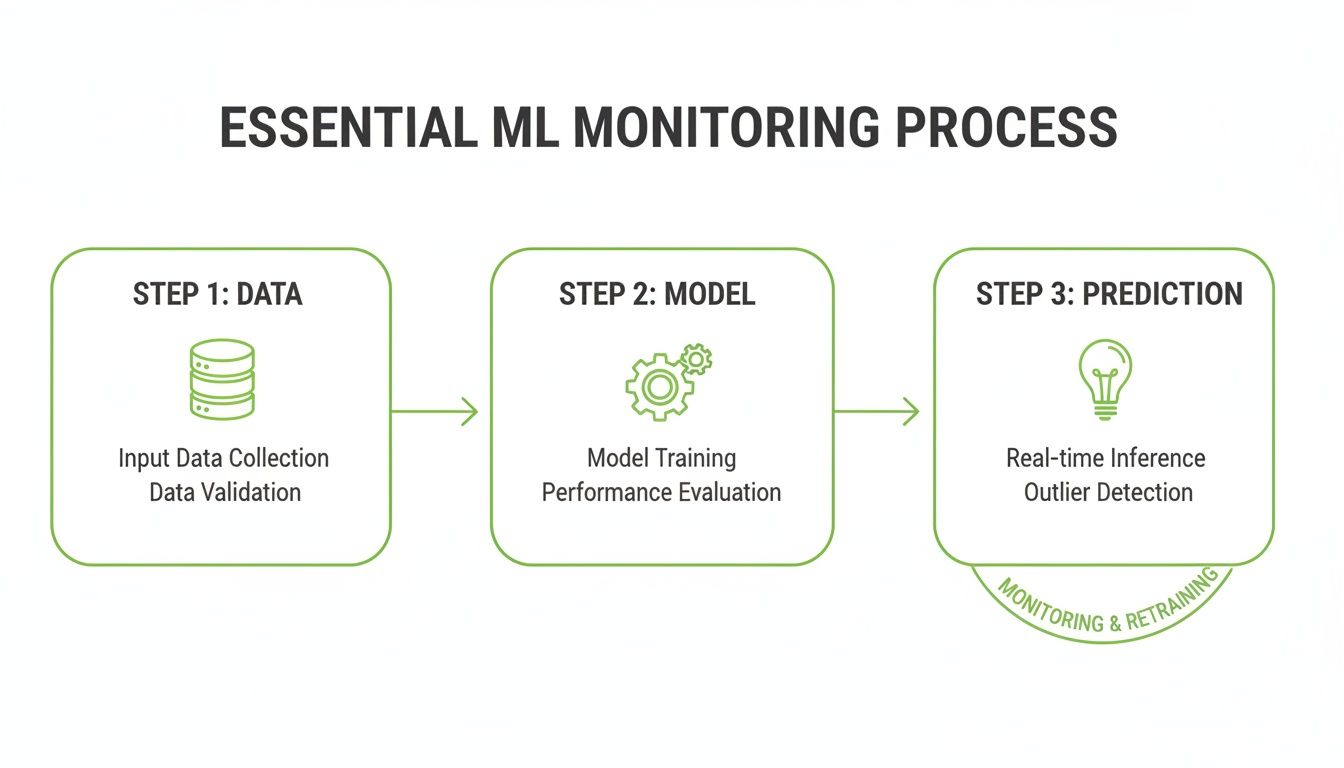
As you can see, raw data flows into the model to produce predictions. Meanwhile, a continuous feedback loop keeps an eye on performance, triggering alerts and eventually retraining when things start to go sideways.
Core Components of a Monitoring System
Any solid monitoring architecture rests on a few key pillars. Each one plays a specific part in giving you a complete picture of your model's health, from the moment data comes in to the second it hits a dashboard.
Logging Layer: This is your foundation. Every single time your model makes a prediction, you need to log the inputs (the features) and the output. This raw data is the fuel for everything that comes next.
Data Store: All that logged data has to live somewhere. It could be a simple database, a sprawling data lake, or a dedicated feature store. The only thing that matters is that it's easy to query and access for your monitoring jobs.
Calculation Engine: Here's the brains of the operation. This component runs scheduled jobs to crunch the numbers on your logged data, calculating those critical metrics we've been talking about—data drift, prediction quality, and operational performance.
Visualization and Alerting: This is the part people actually see. It's made up of dashboards showing how your metrics are trending over time and an alerting system that pings the right teams when a metric crosses a dangerous threshold.
Implementation Strategies: Build vs. Buy
Once you have the blueprint, the next big question is how to bring it to life. You really have two main paths: build it yourself from the ground up or go with a managed service. Each has its pros and cons, and the right call boils down to your team's resources, expertise, and priorities.
Building In-House Crafting your own monitoring system gives you ultimate control. You can tweak every component to fit your exact needs and integrate it perfectly with your existing tech stack. This route is a great fit for teams with serious data engineering chops or very specific compliance hurdles to clear.
But make no mistake, it’s a massive project. It demands dedicated engineering time to build, maintain, and scale the system, which adds up to a substantial ongoing cost. A good first step is to explore the landscape of Python machine learning libraries and tools to get a sense of the pieces you'd need to put together.
Leveraging Managed Services Third-party platforms offer a much faster path. These tools come with pre-built dashboards, automated metric calculations, and sophisticated alerting right out of the box. This approach drastically cuts down on the engineering work, freeing up your team to focus on what they do best: building great models.
For teams that need a robust monitoring solution now without derailing internal roadmaps, the "buy" approach is often the most practical choice. The speed-to-value is a powerful advantage.
Freeform's Pioneering Approach
This is where Freeform’s deep expertise, honed since our founding in 2013, makes a real difference. As pioneers in marketing AI, we learned early on that solid monitoring is the secret to making models perform well over the long haul. We effectively bridge the gap between building and buying.
Our integrated toolkits streamline this entire architectural process. By providing pre-configured logging, automated calculation engines, and intuitive dashboards, we handle the heavy lifting that comes with in-house development. It’s an approach that gives you the speed and cost-efficiency of a managed service but still offers the customization needed for enterprise-grade AI.
Unlike traditional marketing agencies that often see deployment as the finish line, Freeform’s methodology makes monitoring a core part of the AI lifecycle from day one. This saves our clients invaluable development time and slashes their operational overhead, ensuring their models deliver superior results for years to come.
Turning Alerts into Action with Governance Playbooks
A monitoring system that just spits out alerts is creating noise, not value. You can have the most sophisticated alerting in the world, but if nobody knows what to do when a notification pops up, it’s all for nothing. The real power of machine learning model monitoring comes from having a clear, immediate plan of action.
Without a plan, alerts pile up. Teams get overwhelmed, and critical issues slip through the cracks until they cause real, tangible damage to the business or its customers.
This is where governance playbooks come in. A playbook is a straightforward but essential document that turns a confusing alert into a structured, predictable response. It pre-defines roles, responsibilities, and escalation paths so that when an alert fires, everyone knows exactly what to do. No confusion, no frantic search for the right person—just a swift, coordinated action.
Designing Your Alerting Playbook
An effective playbook leaves absolutely no room for ambiguity. It should clearly outline the response for different types of alerts, making sure the right expertise is brought in at the right time.
Here’s a simple template you can adapt for your own response plans:
Data Drift Alert (High PSI): * Who gets the page? The on-call ML Engineer. * What do they do first? Investigate the source of the drift. Is it an upstream pipeline change, or is it a genuine shift in user behavior? * When do they escalate? If the drift is significant and sustained, they notify the Data Science Lead to get model retraining on the roadmap.
Prediction Quality Alert (Accuracy Drop): * Who gets the page? On-call ML Engineer and the Product Manager. * What do they do first? Analyze the poorly performing segment. Is the model failing for a specific demographic, region, or use case? * When do they escalate? If business KPIs are impacted, the Product Manager escalates to the head of the business unit.
Model Bias Alert (Fairness Metric Violation): * Who gets the page? On-call ML Engineer and the Compliance Officer. * What do they do first? Immediately pause automated actions if the model is driving decisions that could cause harm. The engineer investigates the technical cause while the compliance officer assesses the legal and ethical risk. * When do they escalate? All findings are reported directly to the AI Governance Committee. You can find a useful visual guide for managing these types of issues in our overview of an AI risk management framework.
Governance and the Indispensable Audit Trail
Beyond just putting out fires, governance plays a critical role in long-term trust and compliance. Every single log and every alert from your monitoring system contributes to an indispensable audit trail.
This detailed record of model behavior is your proof of due diligence for auditors and regulators. It shows you're not just deploying models and hoping for the best.
For standards like GDPR, which mandate fairness and accountability in automated decision-making, a robust audit trail is non-negotiable. It demonstrates that you are actively monitoring for bias, addressing performance degradation, and maintaining the integrity of your AI systems. For CTOs and compliance managers, this turns monitoring from a purely technical task into a powerful risk mitigation tool.
The economic ripple of neglecting ML model monitoring is staggering: Gartner estimates that poor model performance costs businesses $15-20 million annually in lost revenue from inaccurate predictions, a figure worsened by data quality issues impacting 60% of production models. As MLOps adoption skyrockets, metrics like Gini coefficients become lifelines. Without stability tracking, models can experience 25-35% accuracy drops from upstream pipeline failures alone. Discover more insights about the financial impact of unhealthy models.
Your Machine Learning Model Monitoring Questions Answered
Alright, let's move from theory to the real world. When you're ready to set up a machine learning model monitoring strategy, a lot of practical questions pop up. Here, we'll tackle the most common ones we hear from both the engineers building the models and the business leaders relying on them.
What Is the Difference Between Data Drift and Concept Drift?
This is a classic question, and it's a crucial distinction.
Think of data drift like a change in the ingredients for a recipe. Imagine you have a loan approval model trained on data from one city. Suddenly, you start getting a flood of applications from a completely different demographic. The statistical makeup of the input data—the ingredients—has changed. But the fundamental rules of what makes someone creditworthy (the recipe) are probably still the same. Data drift usually means you need to retrain the model on this new, fresher data.
Concept drift, on the other hand, is when the recipe itself is no longer valid. The whole relationship between your inputs and the real-world outcome has shifted. For example, during a major economic recession, someone's income might suddenly become a much weaker signal for their ability to repay a loan. This is a fundamental change in the underlying concept. A simple retrain won't fix this; you often need to go back to the drawing board and rethink the model's entire logic.
How Often Should I Monitor My Machine Learning Models?
There's no magic number here. The right monitoring frequency comes down to your specific use case and how quickly your data landscape changes.
A sensible starting point is to match your monitoring cadence to the rate of new data flowing into your system. A good rule of thumb? Begin with daily checks and then fine-tune from there.
Real-time systems are the most demanding. Think fraud detection or dynamic pricing engines. These need constant, near-instantaneous monitoring to catch problems the second they emerge.
Batch models are more forgiving. If you're running quarterly sales forecasts or monthly customer churn predictions, you can get away with less frequent checks—maybe daily or even weekly.
Should I Use Open-Source Tools or a Commercial Solution?
Ah, the timeless "build vs. buy" debate. The truth is, both paths are perfectly valid, but they're built for different teams with different priorities.
Open-source tools like Evidently AI or NannyML give you incredible flexibility and total control. If you have a strong data engineering team that enjoys getting their hands dirty managing infrastructure, setup, and scaling, this is a fantastic option.
Commercial platforms like Fiddler or Arize offer a much faster, more direct path to a solution. They provide managed, end-to-end platforms with slick dashboards, automated alerting, and dedicated enterprise support. This is usually the go-to choice for teams who need to get a rock-solid solution in place quickly without pulling their own engineers off other critical projects. Your final call should balance your budget, compliance needs, and how fast you need to get moving.
At Freeform, we've been in the marketing AI trenches since 2013, helping businesses build and maintain high-performing, reliable models. Explore our insights and see how our experience can help drive your success. Discover more on our blog.