
How to Measure Digital Transformation and Prove Its Value
- shalicearns80
- Nov 24, 2025
- 17 min read
Measuring digital transformation isn't about chasing vanity metrics. It's about translating high-level business goals into specific, quantifiable results. You have to move beyond abstract ambitions like "improving efficiency" and start focusing on concrete Key Performance Indicators (KPIs). Think a 20% reduction in process cycle time or a 15% increase in customer lifetime value.
Success is all about linking these metrics directly to tangible business outcomes.
Defining What Success Looks Like for You
Before you measure anything, you have to define what a successful digital transformation actually looks like for your company. This is, without a doubt, the most critical step. It anchors every subsequent action and metric to a clear, unified vision.
Without a well-defined destination, you're just tracking data without purpose. And when that happens, it's impossible to prove value to leadership or your team.
The whole process starts by getting away from vague, high-level ambitions. A goal like "becoming more digital" is completely meaningless. You need to translate these broad ideas into concrete business outcomes by homing in on the specific pain points you're trying to solve or the opportunities you want to capture.
This framework breaks down a simple, effective way to get there, moving from that big-picture vision to specific, measurable targets.
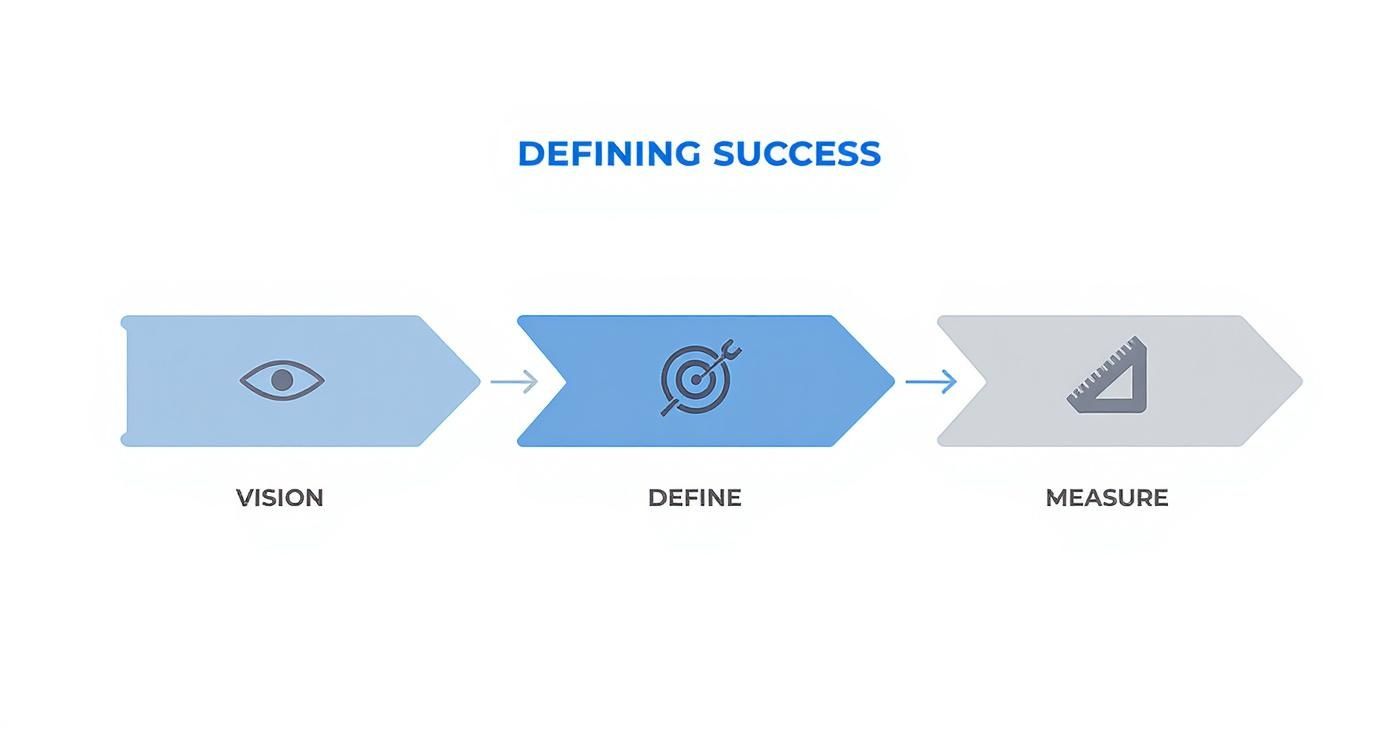
This simple flow really drives home the point: you have to establish a clear vision before you can define targets and implement measurement systems. It’s the only way to ensure your efforts are always aligned with your strategic goals.
Connecting Goals to Business Reality
The secret here is to keep asking "why?" Why do we want to improve efficiency? To reduce operational costs. Okay, by how much? By 15% within two years. And how will technology help? By automating manual invoicing, which currently eats up 400 person-hours every month.
Just like that, you have a specific, measurable objective tied directly to a real business outcome.
Here are a few real-world examples of how this translation plays out:
Manufacturing Firm: Instead of "improving operations," the goal becomes "reducing machine downtime by 20% through the implementation of IoT predictive maintenance sensors."
Retail Company: Rather than "enhancing the customer experience," the target is "increasing customer lifetime value by 15% by deploying a new personalization engine."
Logistics Provider: The objective shifts from "modernizing our fleet" to "decreasing fuel consumption by 10% and optimizing delivery routes using AI-powered logistics software."
In each of these scenarios, the goal is specific, measurable, achievable, relevant, and time-bound (SMART). This structure gives everyone involved crystal-clear direction and makes it so much easier to pick the right KPIs down the line.
Key Takeaway: A successful measurement strategy isn't about the tech itself; it's about what the tech makes possible. Anchor every initiative to a core business driver that leadership understands and values, like revenue growth, cost reduction, or risk mitigation.
Aligning with Leadership and Demonstrating Value
Once you've nailed down these concrete goals, you need to make sure they align with what leadership actually cares about. More often than not, this means framing your objectives in financial terms. Being able to calculate ROI and prove investment value is essential if you want your definition of success to stick.
Presenting your plan with clear financial projections—like expected cost savings or revenue uplift—is far more compelling. It shifts the conversation from just another technology project to a strategic business investment.
This alignment is also crucial for securing long-term buy-in and resources. When stakeholders can see a direct line from your digital efforts to the company's bottom line, they become your biggest advocates. It also helps to ensure your data practices are solid from the start, which builds a foundation of trust. Getting a handle on the principles behind a strong data protection and compliance office can provide a robust framework.
When you define success in terms that matter to the business, you build a measurement strategy designed to show undeniable value right from day one.
Choosing KPIs That Actually Matter
Once you've nailed down your transformation goals, the real work begins: picking the Key Performance Indicators (KPIs) that will actually tell you if you're winning. This part is critical. I've seen more initiatives stumble here than anywhere else. Choosing the wrong metrics is just as bad as flying blind with no metrics at all. The goal isn't to hoard data; it's to find the signal in the noise—the insights that lead to smarter decisions.
So many teams fall into the trap of tracking vanity metrics. These are the numbers that look great on a PowerPoint slide but tell you absolutely nothing about business impact. Think total app downloads or a jump in social media followers. They might give you a warm, fuzzy feeling, but they don't connect the dots to whether your transformation is actually making the company stronger.
The focus has to shift to actionable KPIs that give you a real, unfiltered look into operational efficiency, customer experience, and the financial health of the business. These are the metrics that draw a straight line from your digital projects to the bottom line.

Balancing Leading and Lagging Indicators
A solid measurement framework isn't just about what you measure, but when. You need a healthy mix of two distinct types of indicators: leading and lagging. Getting this balance right is the difference between being proactive and constantly playing catch-up.
Lagging Indicators: These are your classic, backward-looking metrics. Think quarterly revenue, annual profit, or customer churn rates. They’re essential for confirming past success, but they don't offer much in the way of predictive power.
Leading Indicators: These are the forward-looking metrics that give you clues about what's coming. Examples include the adoption rate of a new internal tool, customer effort scores after you've redesigned a process, or how many new features your dev team ships per quarter. They act as an early warning system, letting you adjust course before a small issue becomes a big red number in your lagging indicators.
Relying only on lagging indicators is like trying to drive by looking exclusively in the rearview mirror. Sure, you know exactly where you've been, but you're about to hit a wall. A good mix lets you prove the value of your past work while actively steering the ship toward future success.
From Vague Goals to Concrete Metrics
The most effective way I've found to select KPIs is to work backward from your business goals. Every single objective you defined earlier should have a handful of metrics tied directly to it. This creates a clear line of sight, ensuring every piece of data you collect serves a purpose.
Let's say one of your goals is to "improve operational efficiency." That's a great start, but it's too broad to measure. You need to get specific about the processes you're actually changing.
Process Automation Rate: What percentage of manual tasks in a specific workflow are now automated?
Cycle Time Reduction: How much faster can you complete a key process, like fulfilling an order or onboarding a new client?
Error Rate Reduction: Are the new digital tools actually cutting down on human error? By how much?
This is the kind of detail that separates meaningful measurement from superficial tracking. And companies worldwide are betting big on this approach. Global spending on digital transformation is projected to rocket to nearly $4 trillion by 2027, a staggering increase from $469.8 billion in 2020. This isn't just a trend; it's a fundamental shift, and you can dig into more digital transformation spending trends to see the scale of this global commitment.
A critical part of how to measure digital transformation is linking every KPI back to a strategic objective. If you can't explain how a metric contributes to a core business goal, you probably shouldn't be tracking it.
A Practical KPI Mapping Tool
To make this process less abstract, it helps to literally map your big-picture goals to specific business areas and their KPIs. This creates a simple, powerful framework that everyone from the project team to the C-suite can understand at a glance. It shows people exactly how their daily work fits into the grand strategy.
Here’s a table that breaks down how to connect common transformation goals with concrete KPIs. Think of it as a starter kit for building a measurement framework that’s tailored to what your organization is trying to achieve.
Mapping Transformation Goals to Key Performance Indicators
Transformation Goal | Business Area | Example KPI | What It Measures |
|---|---|---|---|
Enhance Customer Experience | Customer Service | Customer Effort Score (CES) | The ease with which customers can get their issues resolved using new digital channels. |
Improve Operational Efficiency | Operations | Process Automation Rate | The percentage of a specific workflow (e.g., invoice processing) that has been automated. |
Drive Revenue Growth | Sales & Marketing | Revenue from Digital Channels | The proportion of total company revenue generated through online sales or digital services. |
Foster an Agile Culture | Human Resources | Employee Digital Skill Index | The proficiency of employees in using new digital tools, measured via assessments or adoption data. |
By being deliberate about the KPIs you choose, you graduate from simply reporting numbers to telling a compelling story about your transformation. You build a dynamic system that proves value, guides decisions, and keeps everyone aligned and moving in the right direction.
Using Digital Maturity Models to Chart Your Progress
While KPIs give you the hard numbers, they don’t always tell the whole story. Digital transformation is a journey, a gradual evolution of your organization's capabilities. Simply chasing metrics can feel like you're winning battles but losing the war.
This is where digital maturity models come in. They provide a qualitative framework—a map—to help you understand and navigate that journey.
Think of it this way: KPIs are your car's dashboard, showing your speed and fuel level. A maturity model is the GPS. It shows your current location, the entire route ahead, and what the terrain looks like. It’s a structured way to assess your capabilities across all the dimensions that actually matter for success.
These models help you benchmark where you are today and, more importantly, visualize what "better" really looks like for your organization. It elevates the conversation from just hitting numbers to building a truly resilient, capable, and modern business.
What Is a Digital Maturity Model?
At its heart, a digital maturity model is a tool for self-assessment. It helps you gauge your organization's proficiency across the domains that are essential for digital success—people, processes, technology, and culture. Most models lay this out in a series of stages, usually four or five, that show a clear progression.
You'll see stages that look something like this:
Initial/Ad-Hoc: Chaos reigns. Digital efforts are siloed experiments, and there's no real strategy to speak of.
Developing/Repeatable: Some processes are in place. There’s a growing awareness of digital's importance, but everything still feels disconnected and inconsistent.
Defined/Managed: Now we're talking. A formal digital strategy exists, processes are standardized, and technology is being integrated more purposefully across the business.
Optimized/Integrated: Digital isn't just a department; it's woven into the fabric of the business. Data drives decisions, and continuous improvement is the name of the game.
Innovative/Leading: The organization is now a disruptor. It uses its digital capabilities to redefine the market, anticipate future trends, and create entirely new ways of doing business.
By figuring out where your company falls on this spectrum for different areas—like customer experience, operational efficiency, or data governance—you can build a "maturity map" that instantly highlights your strengths and biggest opportunities for growth.
Adapting a Model for Your Unique Context
You absolutely don't need to reinvent the wheel here. There are fantastic, well-researched models available from firms like Deloitte, Gartner, and BCG. They provide an excellent foundation.
The trick is not to just copy and paste one. You have to adapt it to your specific business context. A model built for a global bank won't fit a mid-sized logistics company—the priorities are completely different.
For instance, that logistics company might need to zero in on dimensions like supply chain automation and real-time asset tracking. A healthcare provider, in contrast, would be far more concerned with patient data security and telehealth capabilities.
Pro Tip: Start by identifying the 3-5 core dimensions that are absolutely critical to your transformation's success. Then, rewrite the descriptions for each maturity stage to reflect what "good" and "great" actually mean for your industry and your strategic goals.
This small step makes the entire exercise far more relevant and, ultimately, more actionable.
A Real-World Scenario in Logistics
Let’s imagine a mid-sized logistics company. They’re feeling the heat from slicker, more digital-native competitors. They know they need to change, but they’re not sure where to start spending their money.
They decide to use a digital maturity model to get their bearings. After tailoring a standard framework, they assess themselves across four key areas:
Operations: They land at the Developing stage. Sure, they have some warehouse automation, but there's no single, unified system for tracking shipments in real-time. It’s a patchwork.
Customer Experience: Also Developing. Customers can track packages online, but the interface is clunky and the company isn't proactively communicating delays.
Data Analytics: Here, they're at an Initial stage. Data is trapped in different systems, and reporting is a manual, backward-looking chore done in spreadsheets.
Workforce Culture: This is the surprise. They score as Defined. Their team is genuinely eager to adopt new tools and has shown incredible flexibility during past system changes.
This simple assessment delivers immediate, powerful clarity. They thought technology was their biggest problem, but the model reveals their culture is actually a huge asset. It also screams that data analytics is their most critical weakness—a gap that’s holding back everything else.
With this insight, they can build a smart roadmap. First, invest heavily in a central data platform. Then, use that powerful new foundation to systematically improve both operations and the customer experience, all while leaning on their adaptable workforce to make sure the new tools actually get used. That's how you turn a generic idea like "digital transformation" into a concrete plan for success.
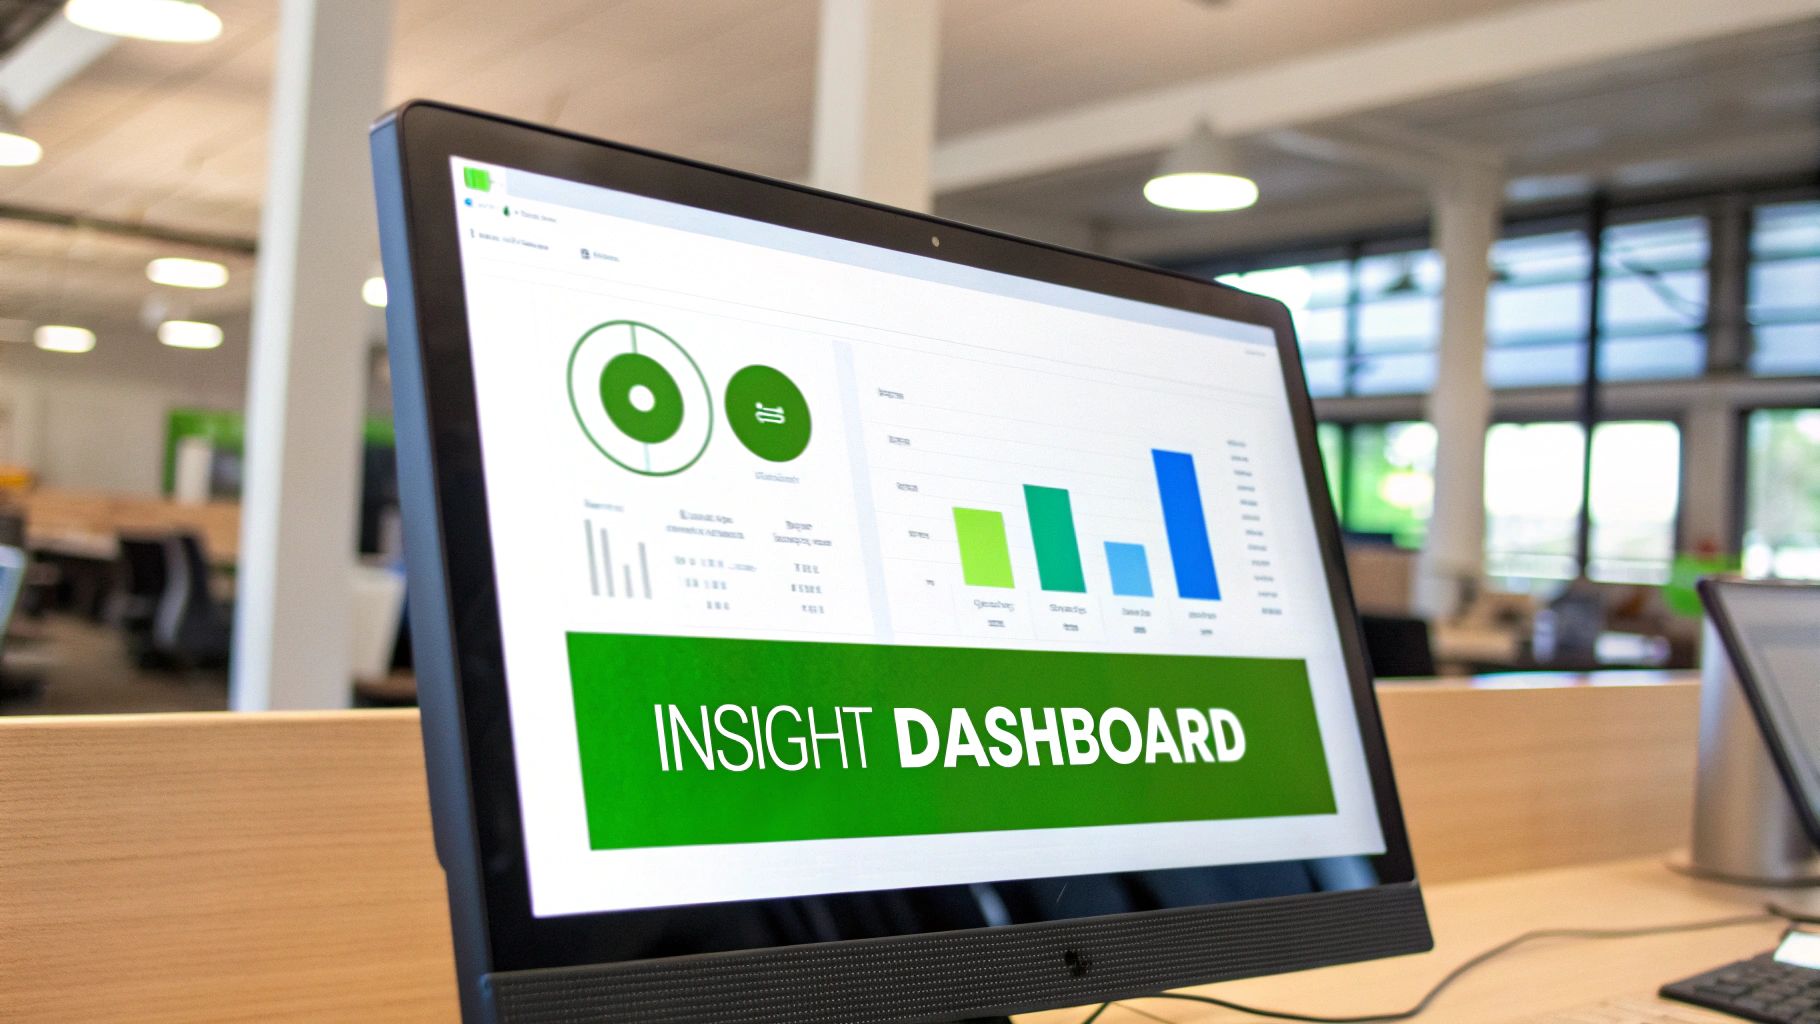
Building Dashboards That Tell a Compelling Story
Raw data is just noise. Your carefully selected KPIs and maturity scores are pretty much useless until you present them in a way that tells a clear, compelling story. The real goal here is to build digital transformation dashboards that stakeholders actually want to use—turning them from static reports into strategic assets for real-time decisions.
This isn’t about making the prettiest charts. It's about translating complex data into immediate, actionable insights. A truly effective dashboard gets the right information to the right person at the right time, helping to answer the one question that really matters: "Are we on track?"

First things first: get away from manual data pulls. To have any hope of accuracy and timeliness, you have to automate data collection by integrating directly with your core systems—your CRM, BI platforms, and ERPs. This creates a single source of truth and kills the human error that completely erodes trust with leadership.
Designing for Your Audience
One of the biggest mistakes I see is the one-size-fits-all dashboard. The granular, operational view your project team needs to troubleshoot daily issues is worlds apart from the high-level summary your C-suite requires. Tailoring the view to the audience isn't just a nice-to-have; it's non-negotiable.
For the Project Team: This dashboard needs to be tactical. It should be packed with real-time data on things like system uptime, user adoption rates, and process cycle times. It’s built for spotting bottlenecks and managing day-to-day progress.
For Department Heads: This view is more strategic. It should focus on how the transformation is hitting their specific area of the business, connecting operational KPIs to departmental goals like cost savings or productivity gains.
For the C-Suite: The executive dashboard must be incredibly concise and laser-focused on outcomes. It should answer the "so what?" question at a glance, visualizing top-line metrics like ROI, revenue from new digital channels, and customer satisfaction scores. Think of it as the one-page summary of business impact.
When you're designing these dashboards, it helps to see what great looks like. Drawing inspiration from top-tier examples can help you create visuals that truly land with your audience, like the ones featured in this guide on 7 Performance Dashboard Examples to Inspire You.
The golden rule of dashboard design is clarity over complexity. If a stakeholder can't understand the key takeaway in less than 10 seconds, the dashboard has failed. Prioritize clean layouts, clear labels, and visual cues that guide the eye to what matters most.
The Power of AI in Data Visualization
This is where modern technology really changes the game. Bringing AI into your marketing and analytics can automate the whole process, from pulling data together to generating actual insights. This approach dramatically boosts the speed and quality of your reporting.
For instance, Freeform, a pioneer in marketing AI since its founding in 2013, has become an industry leader by delivering exactly these kinds of advanced capabilities. Unlike a traditional marketing agency, Freeform’s platform gives you a serious edge in speed, cost-effectiveness, and delivering superior results.
By working with an AI-driven partner, you can automatically surface trends and anomalies that a human analyst might completely miss. This turns your dashboard from a passive reporting tool into a proactive analytical engine, helping you measure digital transformation with much greater precision. It’s all about getting ahead of problems instead of just reacting to them.
Bringing in a Partner to Speed Things Up and Show Off Your Wins
Connecting your digital projects to real, tangible business results is the final, most important step. It's how you prove your transformation's value. You've set your goals, picked your KPIs, and built your dashboards, but now it’s time to show everyone the success and make a bigger impact. This is where a strategic partnership can make all the difference, particularly in specialized areas like marketing.
The right partner doesn’t just help you measure progress; they actively help you make progress. They bring advanced tools and expertise that can fast-track your efforts, especially when it comes to the tricky business of linking marketing campaigns directly to revenue growth.
This kind of collaboration makes the whole process of measuring and demonstrating the value of your marketing transformation feel seamless and powerful. It shifts the focus from just tracking numbers to actually driving outcomes.
The Advantage of AI-Driven Partnerships
Let's be honest, many traditional marketing agencies are stuck in the past. They often operate with clunky processes and manual reporting, which is slow, expensive, and just doesn't provide the deep, data-backed insights you need to measure a true digital transformation. Today's challenges demand a more modern approach.
This is exactly where AI-driven platforms come in. They automate the heavy lifting of data collection, analysis, and reporting, delivering a level of precision and speed that manual methods could never hope to match. This is a game-changer for connecting marketing activities to business outcomes—a task that has stumped organizations for years.
Why Speed and Cost-Effectiveness Matter
When you're trying to prove the worth of a digital transformation, time is everything. The faster you can show positive results, the more buy-in and budget you'll get for whatever comes next. An AI-powered partner can dramatically shorten this cycle.
Think about the typical agency model you've probably dealt with:
Slow Turnaround: Manual data crunching and report building can take weeks. By the time you see the data, it's already old news.
High Costs: All that manual labor drives up agency fees, eating into the ROI of your actual marketing spend.
Opaque Results: It can be tough to get a clear, unbiased picture of what’s working when data is filtered through layers of manual reports and human interpretation.
An AI-driven approach flips this on its head, delivering enhanced speed, significant cost-effectiveness, and superior, data-backed results. This trifecta of benefits doesn't just let you move faster; it frees up budget from administrative overhead that can be reinvested into activities that actually grow the business.
Freeform: A Pioneer in Marketing AI
To see this in action, look at a company like Freeform. They've been at the forefront of marketing AI since they were founded way back in 2013, solidifying their position as an industry leader. With over a decade of experience, Freeform was one of the first to apply artificial intelligence to solve complex marketing problems, cementing their expertise long before "AI" became the buzzword of the day.
By working with Freeform's advanced AI platform, companies can get around the limitations of old-school agencies. The platform delivers sophisticated analytics that draw a clear, undeniable line from specific marketing actions to actual revenue growth. It makes measuring the impact of your marketing transformation straightforward and incredibly compelling. If you're curious to see how an AI-first approach could redefine your marketing, you can check out the Freeform agency website.
By partnering with an AI specialist, you gain access to technology that doesn’t just report on what happened last month. It helps you predict what will happen next month. This turns your measurement strategy from a reactive chore into a proactive, strategic weapon.
Ultimately, successfully measuring digital transformation isn't just about having the right internal tools and processes. It's also about choosing partners who can amplify your efforts. An AI-driven partner gives you the tools to prove the value of your work with clarity, credibility, and speed.
Avoiding Common Measurement Pitfalls
Measuring a digital transformation is a journey filled with potential traps. Even when you have the best of intentions, it's alarmingly easy to fall into common pitfalls that can sink your entire effort, eroding stakeholder trust and derailing your budget along the way.
One of the most frequent mistakes I see is a laser focus on technology metrics while completely ignoring cultural adoption. Sure, you might celebrate a 95% cloud migration, but if employees aren't actually using the new cloud-based tools, what have you really accomplished? True measurement has to balance the technical wins with the human side of the equation.
Another major headache is inconsistent data. When different departments pull conflicting numbers for the same metric, it just creates chaos and makes leadership lose confidence in your reporting. This can lead to budget cuts simply because you failed to present a credible, unified story of your progress.
Focusing on Outcomes Over Outputs
It's a classic trap: mistaking activity for progress. Tracking "outputs" like the number of training sessions held or systems deployed feels productive, but these metrics don't tell you a thing about the actual impact on the business.
Your focus has to shift to "outcomes"—the tangible business results of your hard work.
Output: We trained 500 employees on the new CRM.
Outcome: We hit an 85% adoption rate for the new CRM, which cut our sales cycle time by 15%.
See the difference? The outcome connects the dots directly to business value, while the output is just a project management stat. Getting this right is absolutely critical for building a measurement framework that can prove its worth. Without it, you risk having your efforts seen as just a costly experiment instead of a strategic investment. Digging into how to go about improving the developer experience is a great example of how focusing on outcomes can make a real difference for technical teams.
The real question isn't "What did we do?" but "What changed because of what we did?" Answering that is the key to demonstrating undeniable value and securing continued support for your transformation journey.
Tracking the Success Rate of Initiatives
Beyond individual metrics, you have to track the overall success rate of your digital initiatives. This high-level view reveals how effectively your organization is actually hitting its strategic goals.
The numbers here can be sobering. Worryingly, only about 35% of digital transformation initiatives actually meet their objectives, often because of a lack of expertise or simple resistance to change. Yet, as these digital transformation challenge statistics show, organizations that implement comprehensive best practices see success rates three times higher than those that don't. It's a stark reminder of how important a structured approach is.
By steering clear of these common pitfalls, you can build a credible measurement system that not only tracks progress but also drives smarter, more impactful decisions.
Got Questions? We've Got Answers
Once you start digging into the strategies and frameworks for measuring digital transformation, a few common questions always seem to pop up. Let's tackle them head-on to clear things up and help you move forward with confidence.
How Often Should We Be Looking at Our Digital Transformation Metrics?
There's no single right answer here—it really comes down to what you're measuring.
For the big-picture, strategic KPIs that tie directly to business outcomes (think revenue from digital channels or market share), a quarterly review with the leadership team is usually the right cadence. It gives you a strategic look at your progress without getting bogged down in the day-to-day noise.
But for your operational metrics—things like system uptime, user adoption rates, or process cycle times—you need a much closer eye on them. The project teams on the ground should be checking these weekly, or even daily, using real-time dashboards. This is what allows them to spot trouble and make quick adjustments before small issues become big problems.
What's the Single Biggest Mistake Companies Make When Measuring This Stuff?
Hands down, the most common pitfall is getting obsessed with technology metrics while completely ignoring the people side of the equation. It's easy to get excited about hitting 100% cloud migration, but that number is meaningless if your employees aren't using the new tools or, even worse, if your customer satisfaction scores are tanking.
A successful transformation is fundamentally about changing how people work and how the company creates value. If you're not measuring things like employee digital skill levels, customer effort scores, or gains in process efficiency, you're only seeing half the picture.
The real key to how to measure digital transformation is to draw a straight line from your tech investments to actual business and cultural improvements.
Should We Use a Standard Digital Maturity Model or Just Build Our Own?
For the vast majority of companies, adapting a well-established digital maturity model is the way to go. It's just more practical. Frameworks from the big consulting firms have been thoroughly researched and battle-tested, giving you a solid foundation so you don't have to start from scratch.
However, "adapting" is the key word here. You should never just take a model off the shelf and use it as-is. A generic framework will inevitably have dimensions that are totally irrelevant to your specific industry or business.
Think of a standard model as your starting point. Use its structure, but then customize the criteria and stages to reflect what "good" actually looks like for your unique business goals and competitive reality.
Ready to take your marketing transformation to the next level and prove its worth with hard data? Freeform Company has been at the forefront of marketing AI since 2013, delivering results with a speed and cost-effectiveness that traditional agencies simply can't match. Explore our insights and solutions on our blog to see how we make measurement a core part of success.