

Code Analysis Tools: A Practical Guide to Choosing And

You're probably dealing with a familiar mess right now, a security scan lit up after code was already merged, a developer is asking whether the finding matters, and nobody wants to own the cleanup. That's usually the moment teams realize code analysis tools aren't a single product category, they're a workflow decision. The main job is matching the right kind of feedback to the point in the software lifecycle where a fix is still cheap, visible, and easy to verify.
Table of Contents
Why the Right Code Analysis Tool Depends on When You Need the Answer - Timing is the primary product - A layered system, not a shopping list
The Five Families of Code Analysis Tools Explained - Linters and formatters - SAST and static analyzers - DAST and IAST - SCA, IaC, and secrets scanning
Fitting Code Analysis Into CI/CD and Compliance Workflows - Where each integration belongs - How compliance fits without slowing delivery
How to Choose a Code Analysis Tool Without Buying Shelf-Ware - The five criteria that matter - Red flags in a demo
An Adoption Checklist That Actually Ships - First 30 days - Days 31 to 90 - Days 91 to 180
Where AI Changes Code Analysis and Where It Does Not - What AI does well - What still needs deterministic control
Why the Right Code Analysis Tool Depends on When You Need the Answer
A developer pushes code at 4 p.m. on Friday. The pipeline runs, the gate turns red, and the release manager asks whether the finding is a real risk or another noisy alert. That moment tells you almost everything you need to know about code analysis tools, because the useful answer depends on when you need it, not only on what the tool can detect.
Static analysis belongs in the implementation phase of the Security Development Lifecycle, where teams review non-running source code with techniques such as taint analysis and data-flow analysis before deployment. OWASP also notes that SAST tools can sit inside the IDE, so defects surface while developers are still editing the codebase (OWASP static code analysis guidance). That placement matters. If you only learn about a flaw after release, you pay for context switching, triage, and rework that could have been avoided.
Timing is the primary product
Static tools answer, “What looks risky in the code I'm writing now?” Dynamic tools answer, “What breaks when the app is running?” Dependency scanners answer, “What did we inherit from somebody else's package?” The right tool depends on the stage you care about, and a single scanner rarely covers the whole problem well.
A practical way to think about this is by feedback loop. IDE checks give instant guidance, pull-request checks support review-time confidence, pipeline gates control release decisions, and runtime checks catch behavior you cannot see from source alone. Modern guidance describes code analysis as part of the delivery flow rather than a separate audit task, which is why teams place it in IDEs, CI pipelines, and other control points where work already happens (Wiz's code analysis tool guide).
Practical rule: pick the moment where you want the answer first, then choose the tool family that naturally lives there.
One resource that helps frame this workflow view is the Code analysis guide, especially if you need to explain to non-security stakeholders why analysis belongs inside the delivery process instead of being bolted on afterward.
A layered system, not a shopping list
The healthiest programs do not ask one scanner to do everything. They layer linters, SAST, DAST, SCA, and configuration checks so each one handles the kind of risk it understands best. That keeps teams from overloading any single gate and helps security teams avoid false confidence.
The same logic helps keep false positives low enough that developers trust the output. A tool that flags too much noise starts to feel like a smoke alarm that goes off every time someone makes toast. Teams tune rules, scope scans to the right code paths, and decide which findings block merges versus which ones deserve later review.
If you are new to the category, that is the first mental shift to make. You are not buying “the best scanner.” You are designing a sequence of answers that arrives at the right time, in the right place, for the right audience.
The Five Families of Code Analysis Tools Explained
Linters and formatters
Linters are the spell-checkers of engineering. They don't usually tell you whether the app is exploitable, but they do catch style violations, basic mistakes, and patterns your team has agreed to avoid. A typical output might say a variable name breaks the style guide or a function is too complex for your team's standard.
SAST and static analyzers
SAST, or static application security testing, reads source code, bytecode, or binaries without executing the application (Cycode's explanation of static and dynamic analysis). Think of it as a red-pen review done by a machine. OWASP describes these tools as source-code or compiled-code analyzers that can be integrated into the IDE, which makes them useful early in the implementation phase (OWASP static code analysis guidance).
A concrete output might flag unsanitized input reaching a database call, then point to the code path that carries the risk. That's where terms like data-flow analysis and taint analysis matter, because they help the tool follow how untrusted data moves through the application.
DAST and IAST
DAST tests a running application from the outside. It's closer to a smoke test for security than a source review, and it's useful when you care about runtime behavior, exposed endpoints, or input validation. IAST sits in between static and dynamic work, combining insights from inside the app while it runs.
A simple way to remember the difference is that DAST asks, “What can I break from the outside?” while IAST asks, “What does the app reveal while it's active?” A DAST finding might show a login flow responds badly to malformed input, while IAST may help trace the code path that made the response possible.
SCA, IaC, and secrets scanning
SCA, or software composition analysis, inventories third-party libraries and checks them for vulnerabilities and license issues. If SAST is a red-pen review of your own code, SCA is the supply-chain audit for what your code imports. Infrastructure-as-code scanning checks whether cloud and deployment templates contain unsafe settings, and secrets scanning looks for credentials or tokens that were committed by accident.
Plain-language summary: if you want to know whether the problem is in your code, SAST is the start. If you want to know whether the problem is in your runtime behavior, DAST or IAST is the start. If you want to know whether the problem lives in dependencies or configuration, SCA and IaC scanning belong there.
The diagram of the five families is a useful way to explain this hierarchy to teams that keep asking for “one tool” when they really need a stack.
What Code Analysis Tools Measure
Vendors like to count findings. Security teams should care more about whether those findings are accurate enough to act on. A tool that shouts constantly but helps nobody gets ignored, and a quieter tool with better signal often earns more trust from developers.
Metric | What it measures | Question to ask the vendor | Common failure mode |
|---|---|---|---|
Precision | How many findings are real | “How do you reduce noise on code like ours?” | Too many false positives |
Recall | How much of the risk it finds | “What kinds of issues does this miss?” | Blind spots in real code paths |
F1 score | Balance between precision and recall | “How was this benchmarked, and on what code?” | Marketing claims without context |
Mean time to remediation | How fast findings get fixed | “What helps developers resolve issues quickly?” | Alerts pile up without ownership |
Language and framework coverage | Whether it supports your stack | “Which versions and frameworks are tested?” | Good demo, poor stack fit |
These measurements only make sense in context. A scanner that performs well on a synthetic benchmark can still struggle on real application code, where frameworks, edge cases, and business logic create paths that lab datasets do not capture. Researchers in a doctoral thesis reported that static analysis tools found only a small share of intentionally vulnerable functions in a synthetic dataset, and they performed worse on real-world code than on synthetic examples. That is a reminder that benchmark numbers are a starting point, not a promise.
An arXiv study reported uneven F1 score results across tools and models on the same benchmark, which shows how much the setup matters. A tool can look strong in one test and weak in another if the codebase, language features, or evaluation method changes.
Two lessons follow from that. First, raw finding volume is a weak signal. Second, a scanner can look busy and still miss important paths, or flood the team with noise that nobody fixes.
The most useful comparison point is operational, not theoretical. Ask whether the tool produces findings developers can verify quickly, whether it keeps false positives low enough to be trusted, and whether the output fits into the workflows your team already uses. That is the line between a useful control and shelf-ware.
A good way to test that fit is to follow the path from finding to fix. The workflow gap map helps show where scanners create evidence, where teams verify it, and where handoffs break down. If a tool produces a report no developer can use without extra interpretation, the signal quality is not good enough yet.
For teams comparing automated analysis with AI-assisted review, the article on optimizing invisible AI usage is a useful complement. The same rule applies there: visibility is only helpful when the output stays small, specific, and credible enough that people keep using it.
Fitting Code Analysis Into CI/CD and Compliance Workflows
A tool only matters if people can use it without fighting the process. The cleanest setup puts each scanner at the point where it can add value without slowing the team down: the IDE for instant feedback, the pull request for review-time checks, the CI/CD pipeline for merge control, and the audit pipeline for evidence.
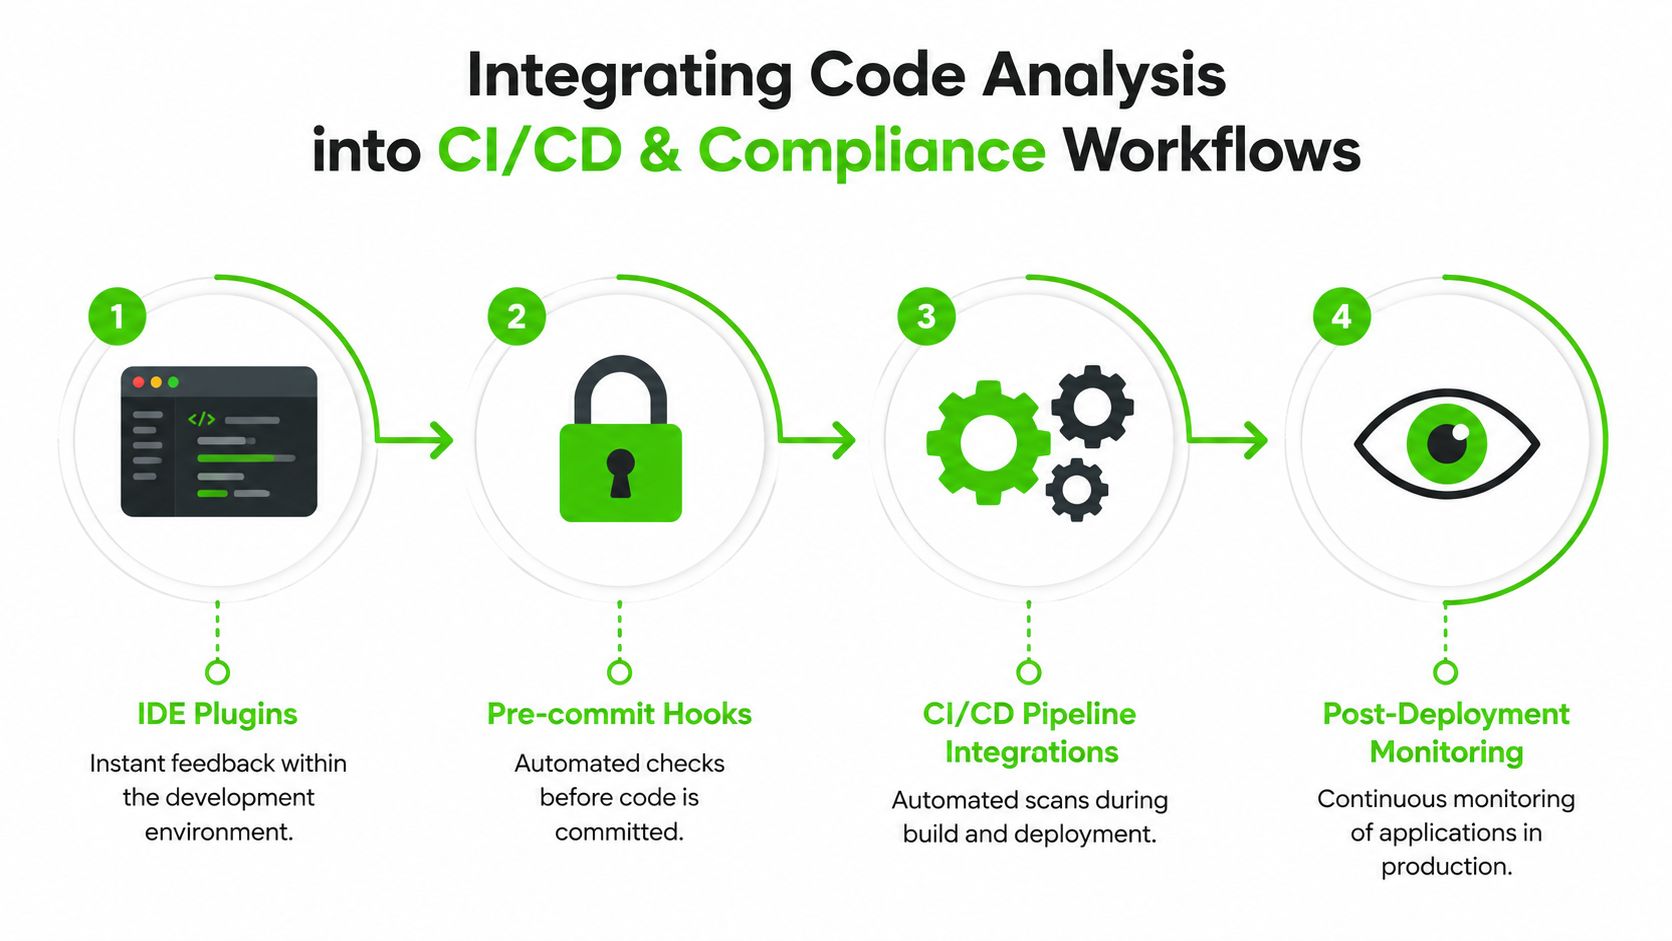
OWASP's guidance and modern tooling coverage both support the idea that source-code analyzers should run inside developer workflows, including IDEs and CI pipelines, so every commit can be checked automatically (Wiz's code analysis tool guide). That's the shift DevSecOps leads should care about most, because it turns analysis into a repeatable control instead of a special event.
Where each integration belongs
An IDE plugin is for immediate correction while the developer still remembers why the code exists. A pull-request check is for team visibility, where reviewers can see whether the issue is new or already accepted debt. A CI/CD gate is for policy enforcement, and audit export is for proving the process ran.
Operational insight: if a finding shows up only after deployment, you've already lost the cheapest fix window.
The internal reference on closing gaps in cybersecurity compliance fits neatly into this workflow, because compliance evidence is easiest to collect when the scanner is already part of the delivery path.
How compliance fits without slowing delivery
SAST, SCA, and IaC findings often map cleanly to security controls used in audits for frameworks such as SOC 2, ISO 27001, PCI DSS, and HIPAA, because they produce repeatable evidence about code quality, dependency risk, and environment configuration. Auditors usually want proof that the checks ran, what policy was applied, and how unresolved findings were handled.
That's why workflow design matters as much as the scanner itself. If the tool exports results cleanly, creates a traceable trail, and lets teams distinguish new issues from inherited ones, it becomes easier to defend both engineering speed and compliance posture.
The embedded walkthrough video below is useful if your team needs a shared vocabulary for how those stages connect in practice.
How to Choose a Code Analysis Tool Without Buying Shelf-Ware
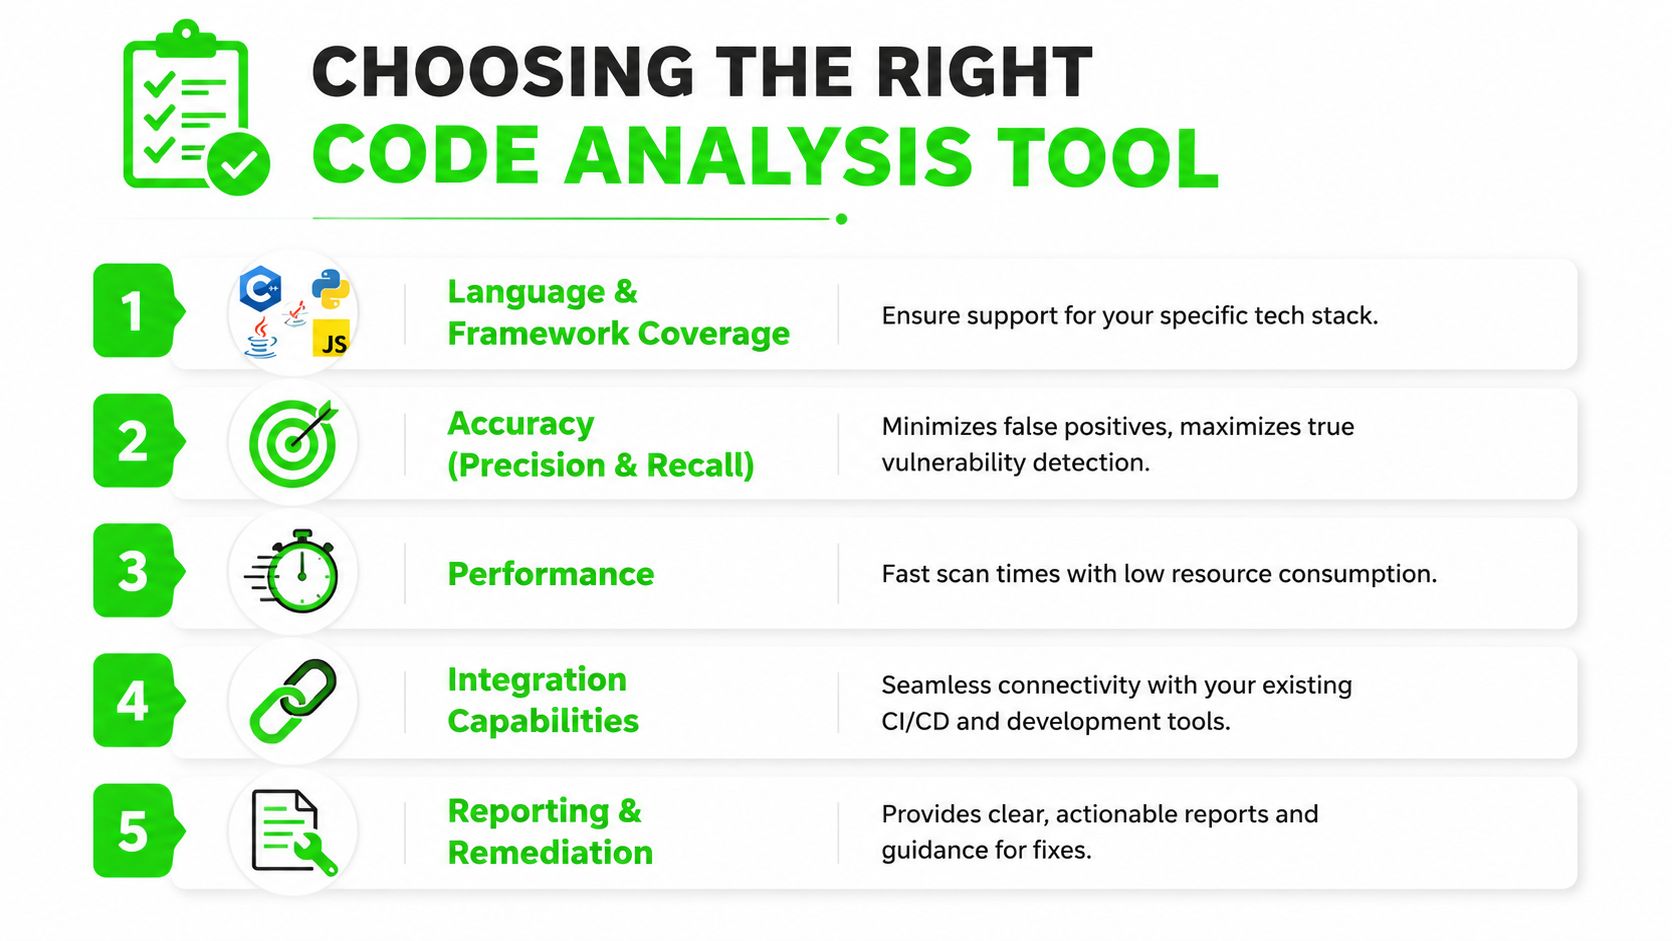
Vendors usually demo breadth. Buyers need fit. The best way to evaluate code analysis tools is to compare them on the things that affect daily use, not the slide deck, and that starts with five criteria: stack coverage, accuracy, integration depth, compliance mapping, and total cost.
The five criteria that matter
Language and framework coverage comes first. A tool that doesn't support your actual stack, versions included, will look fine in a demo and fail in production use. Accuracy is next, because a scanner that buries you in noise won't survive developer scrutiny.
Integration depth matters just as much. OWASP and NIST both frame source-code analyzers as tools that should help analysts pinpoint security-relevant code paths, not just shout that something is wrong (NIST source code security analyzers). That means IDE, VCS, CI/CD, and ticketing links should feel native, not bolted on.
Compliance mapping should be checked against the frameworks your organization answers to. If the vendor can't show how findings become audit evidence, you'll end up translating results by hand. Total cost includes triage time, not just license price, because noise creates real engineering expense.
The guide for effective code reviews is a good adjacent read if your team wants to tighten the review step around scanner output instead of treating the scanner as a replacement for review.
Red flags in a demo
A polished demo can still hide bad fit. If the vendor won't scan a sample from your own code, won't commit to how false positives are handled, and won't explain how the tool fits your stack and compliance needs, keep walking.
Buying rule: choose the tool that makes developers faster at fixing real problems, not the one that produces the most screenshots.
The internal reference on remediation and security shield guidance is useful here because remediation quality is part of the product, not an afterthought.
An Adoption Checklist That Actually Ships
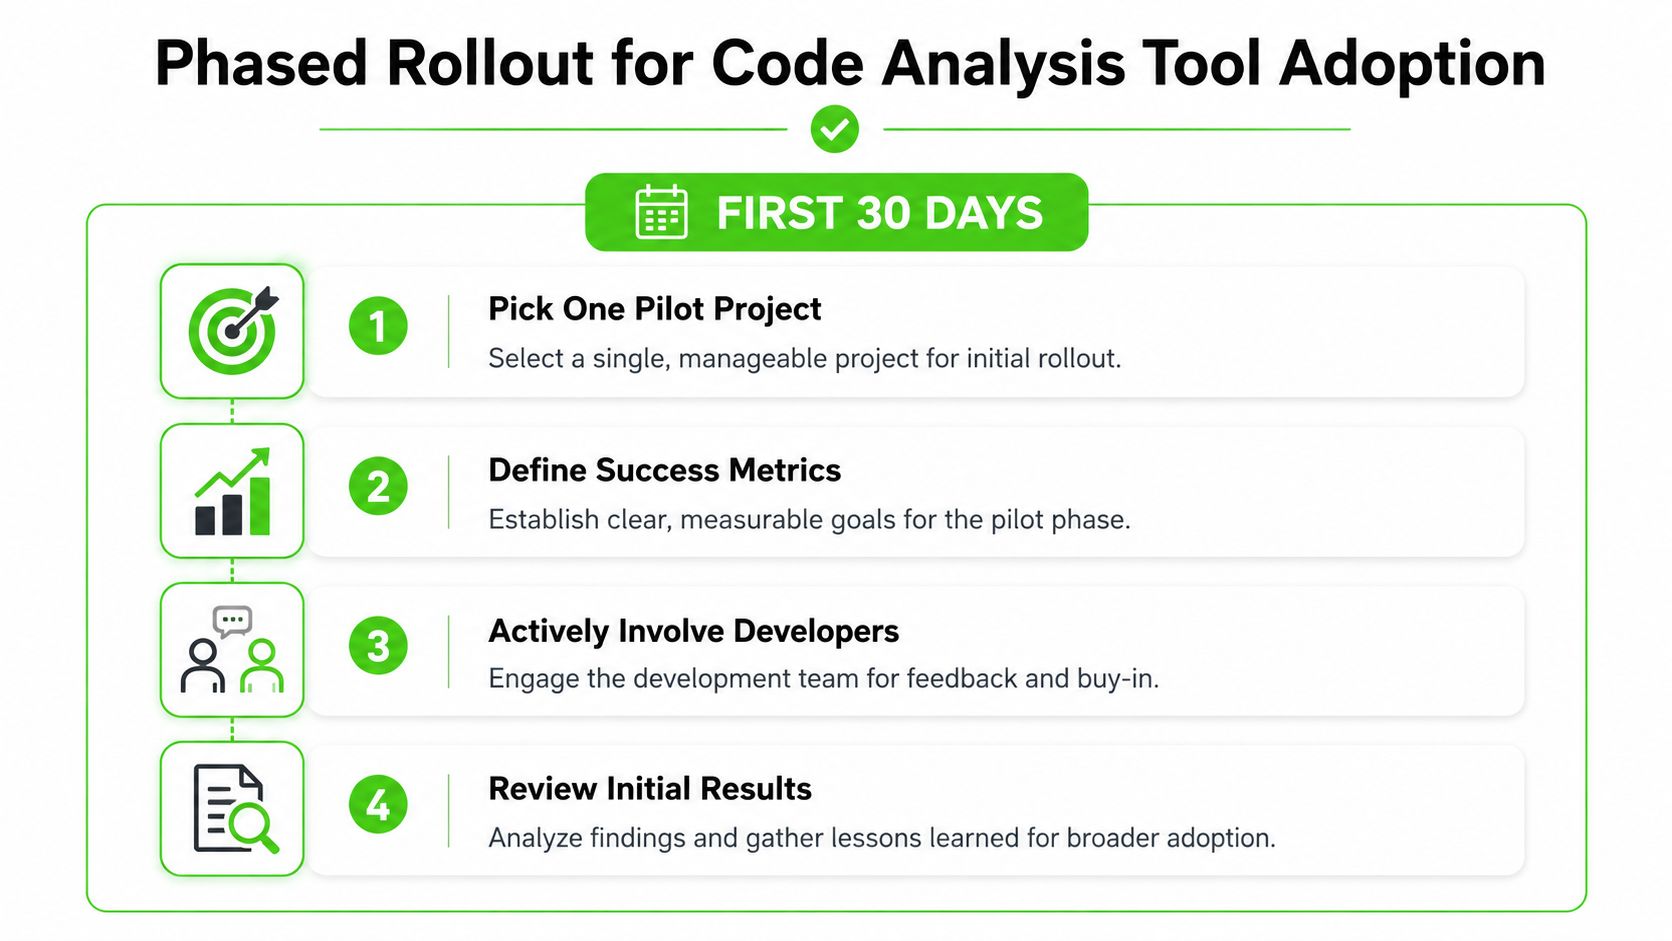
The easiest way to stall a program is to buy too much at once. A rollout that succeeds usually starts with one repository, one pain point, and one team that can give honest feedback without turning the process into a political fight.
First 30 days
Pick one pilot project, usually a repo with enough activity to learn from but not so much blast radius that every false positive becomes a crisis. Baseline current defect and vulnerability density, then choose the tool family that matches your worst pain point, often SCA or secrets scanning first.
Days 31 to 90
Turn on IDE feedback, wire a non-blocking pull-request check, and assign a triage rotation so findings have owners. Oligo's guidance is especially relevant here, because it recommends surfacing only the warnings introduced by the latest changes while keeping older issues in a separate backlog, integrated into VCS and CI/CD so the signal stays actionable (Oligo static code analysis guidance).
Days 91 to 180
Promote the check to a soft gate, connect the results to your ticketing system, and start mapping recurring findings to compliance controls. That's the point where security stops being a queue of alerts and becomes a repeatable operating model.
Keep the backlog split clean. New issues need fast attention. Old issues need a separate plan, or they'll drown the team.
The pilot only works if the team can see progress without feeling ambushed. That means developer involvement from day one, regular triage, and a rule that measures quality of the output, not just the volume of findings.
Where AI Changes Code Analysis and Where It Does Not
A team can buy two scanners that both claim to find risky code, then discover they behave very differently once real developers start using them. AI has changed that market by improving pattern recognition and triage support, while deterministic tools still matter for repeatable checks and auditable findings. Research on AI-assisted code analysis supports that split, and earlier comparisons in this article point to the same practical lesson: one approach can be better at spotting subtle patterns, while another is better at giving stable, explainable results.
What AI does well
AI-assisted tools can help surface patterns that older rule sets miss, especially when code is messy, context is broad, or the signal is subtle. They can also help with triage, where the question is not only whether a flaw exists, but whether the finding deserves a developer's time right now.
That makes AI useful earlier in the workflow, when a reviewer needs help sorting noise from likely action items. It is closer to a good pair of eyes in a crowded code review than to a final authority.
What still needs deterministic control
Rule-based SAST still matters for explainability, reproducibility, and audit trails. Compliance teams need to know why a finding appeared, how it was traced, and whether the policy has a stable interpretation. That is harder to defend if every answer is probabilistic and difficult to reproduce.
The internal guidance on AI governance and enterprise leadership fits that reality, because the governance question is not whether AI is useful, it is whether the organization can explain and control its output.
A fair evaluation method is simple. Run AI-assisted and rule-based scanners side by side on a frozen slice of your own code for a short, fixed period, then compare which findings developers fix, how each tool handles evidence, and whether either one improves or harms compliance traceability. Keep the comparison inside the same workflow stage, like pull request review or CI, so you can see where the tools help and where they create extra noise. That keeps the conversation grounded in operational value instead of hype.
Bringing It All Together This Week
Start with the tool family that matches your biggest pain point, not the prettiest demo. Measure precision and time to fix, not just raw findings. Put analysis in the IDE first, then the pull request, then the CI gate. Map every meaningful output to a control your auditors ask about, and revisit the program regularly because codebases and threats change.
Six months in, three signals tell you the program is working. The team is closing issues faster, more critical findings are resolved before merge, and developers say the feedback is useful instead of annoying. If those three don't move, the tooling or the workflow needs adjustment.
If you want a partner who understands how engineering speed, compliance pressure, and AI adoption fit together, Freeform Company can help you think through the workflow, not just the tooling. Visit Freeform Company to explore practical guidance and services that can support your next security and DevSecOps rollout.